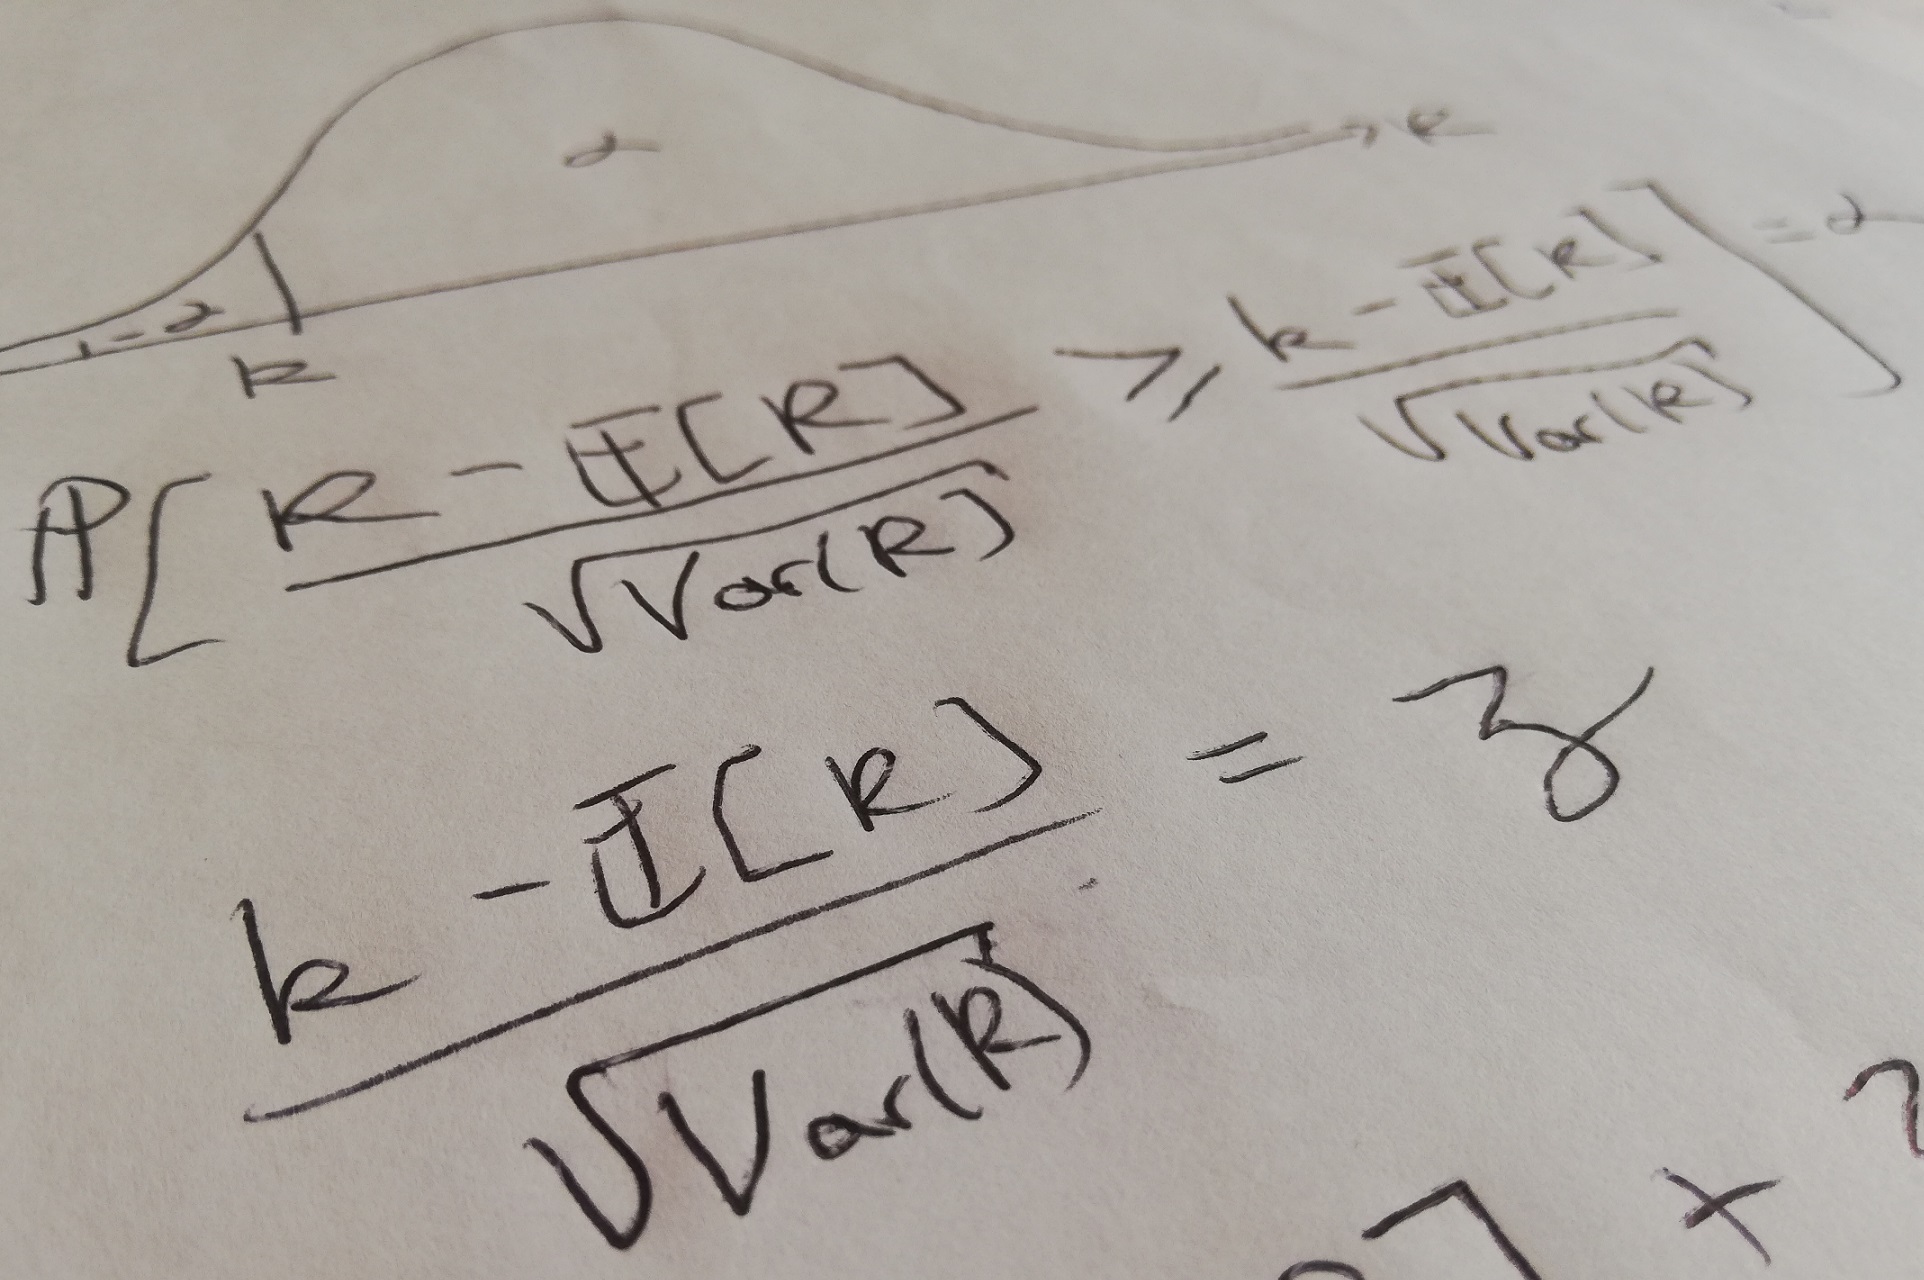
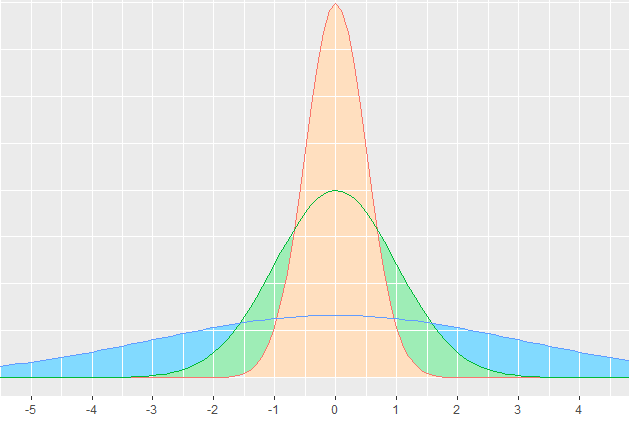
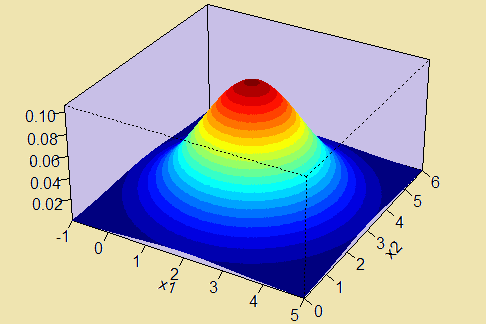
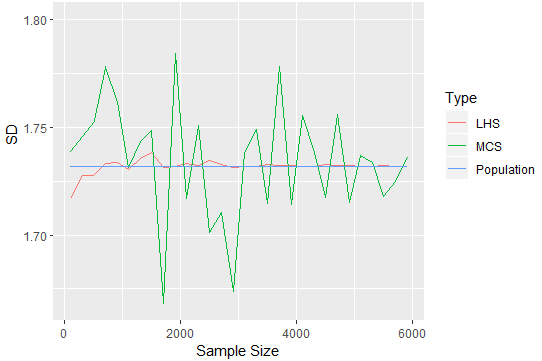
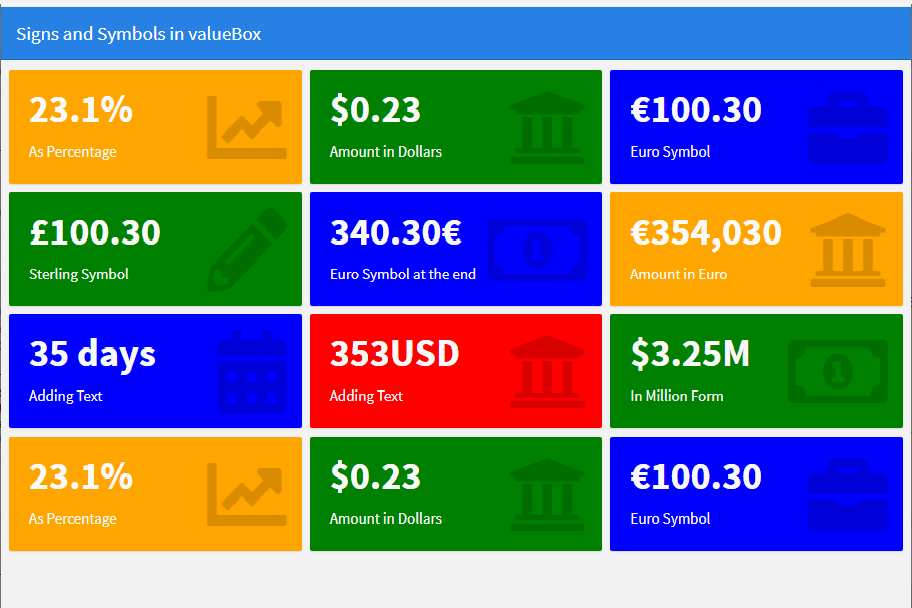
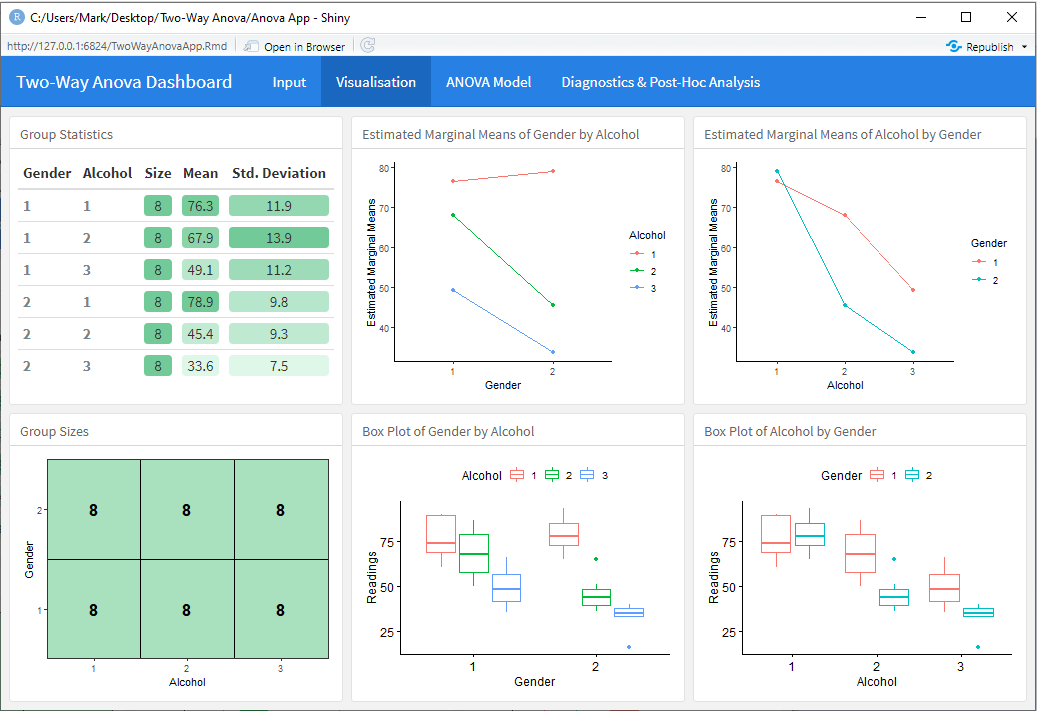
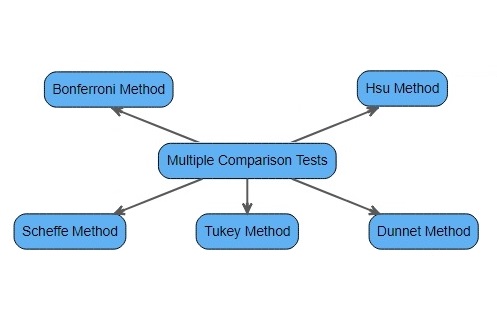
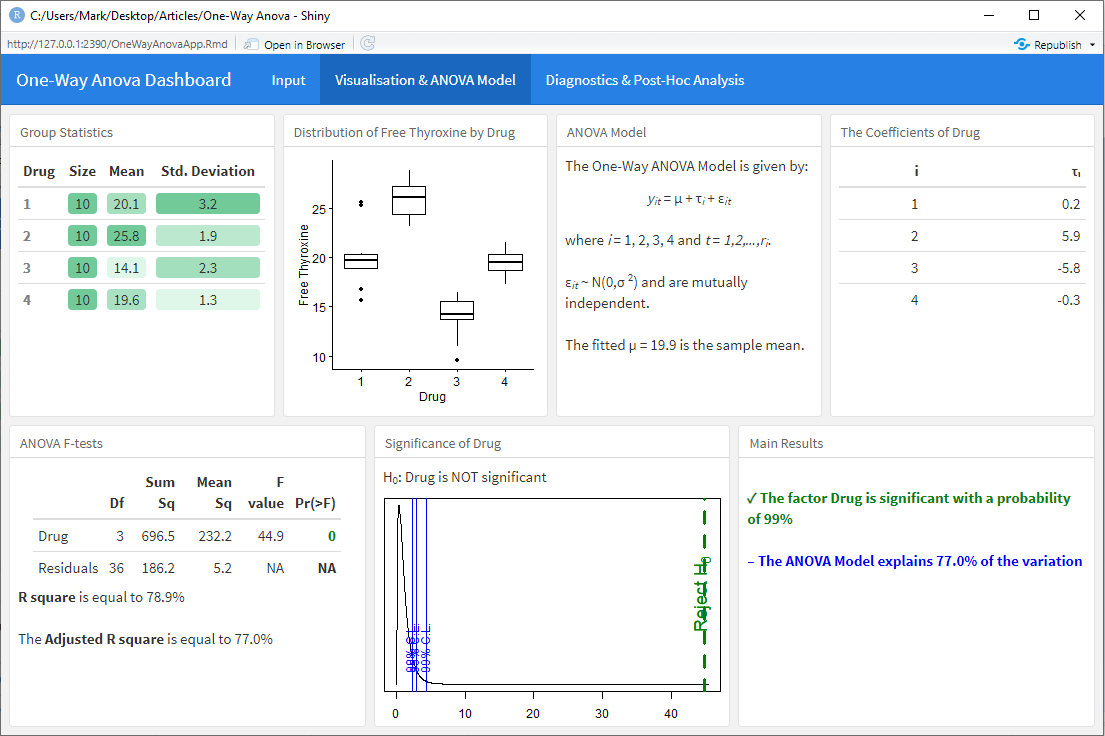
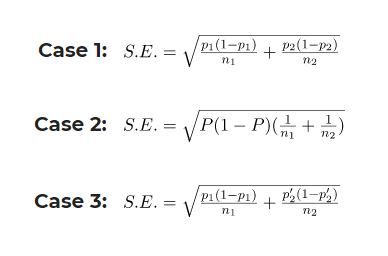
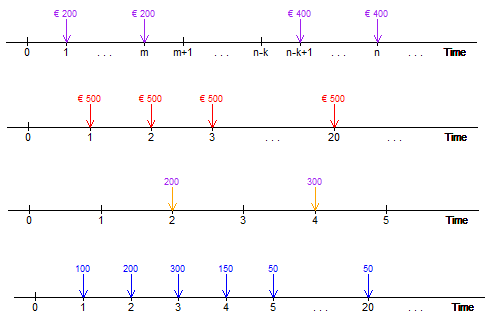
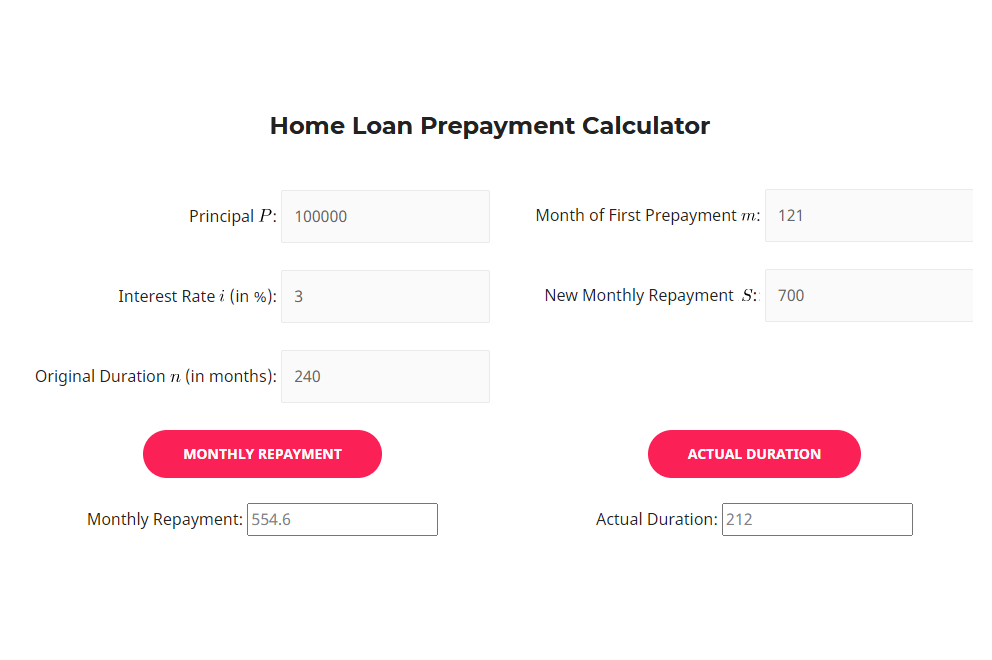
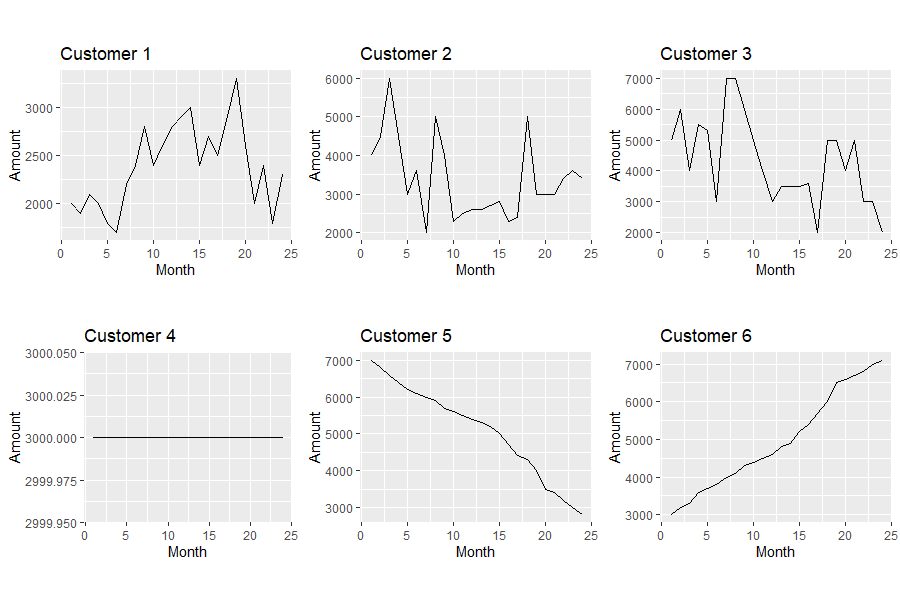
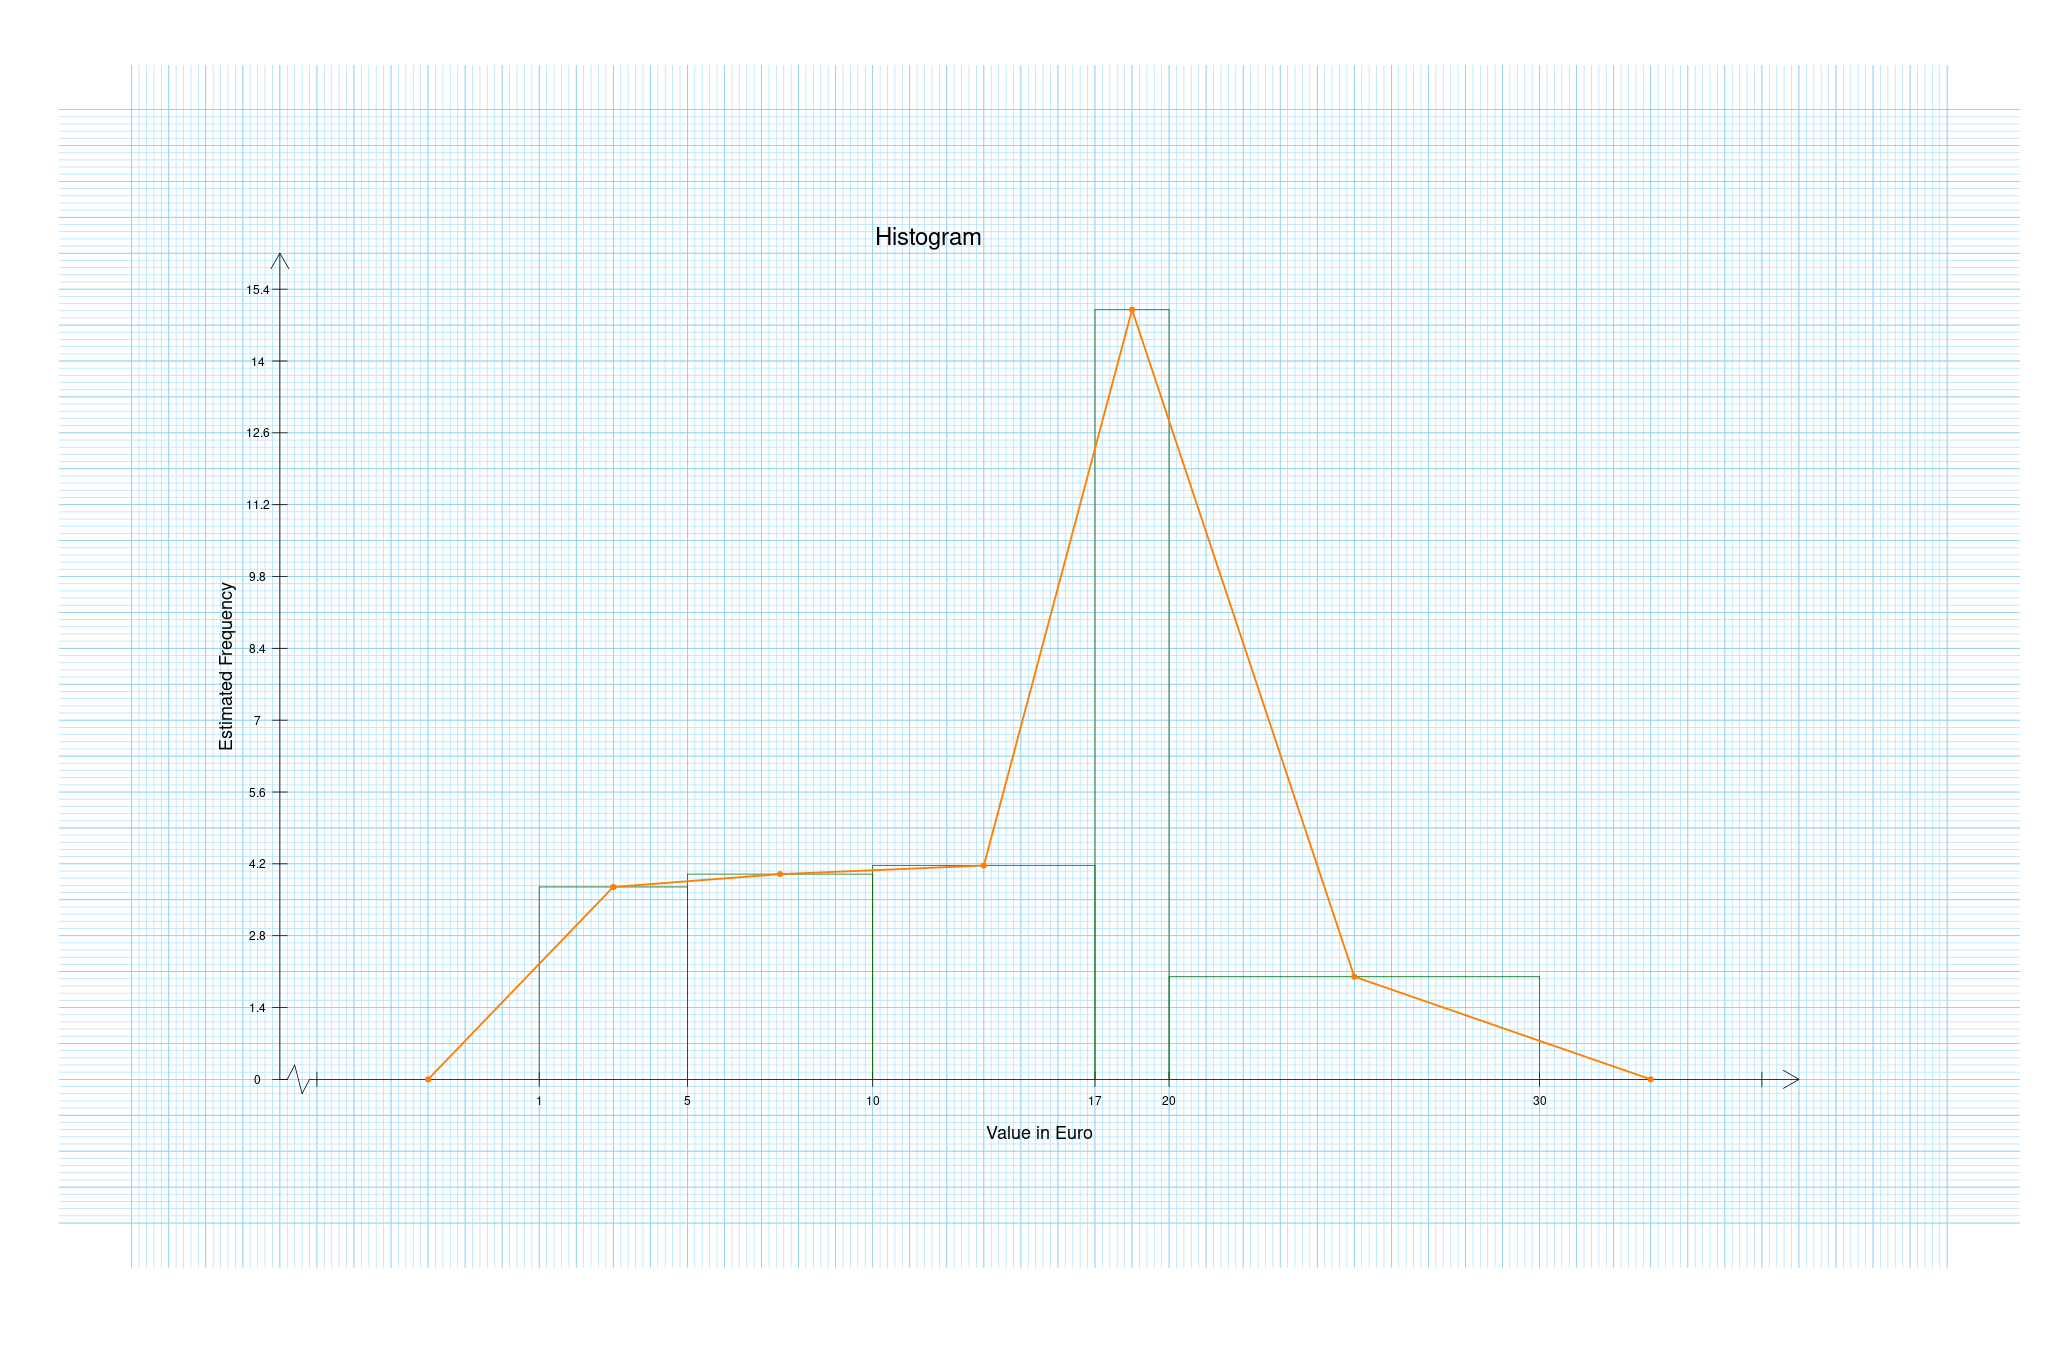
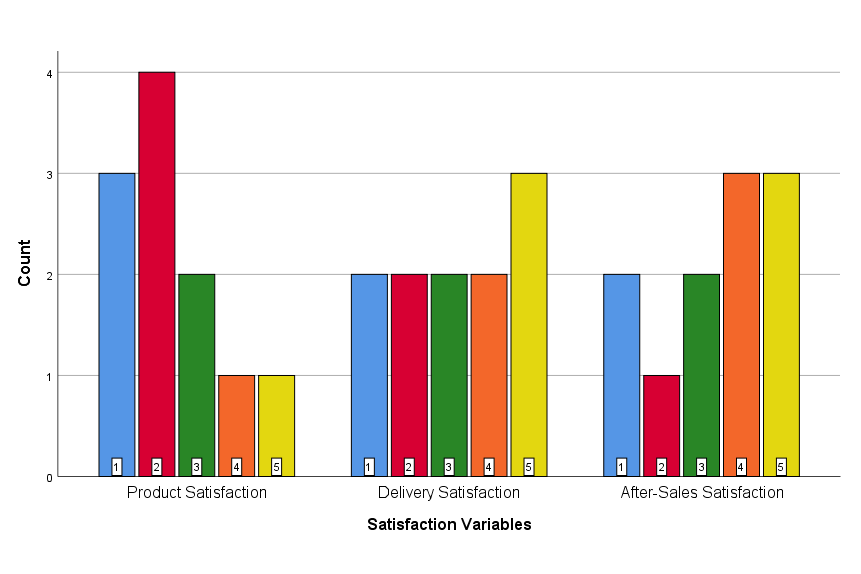
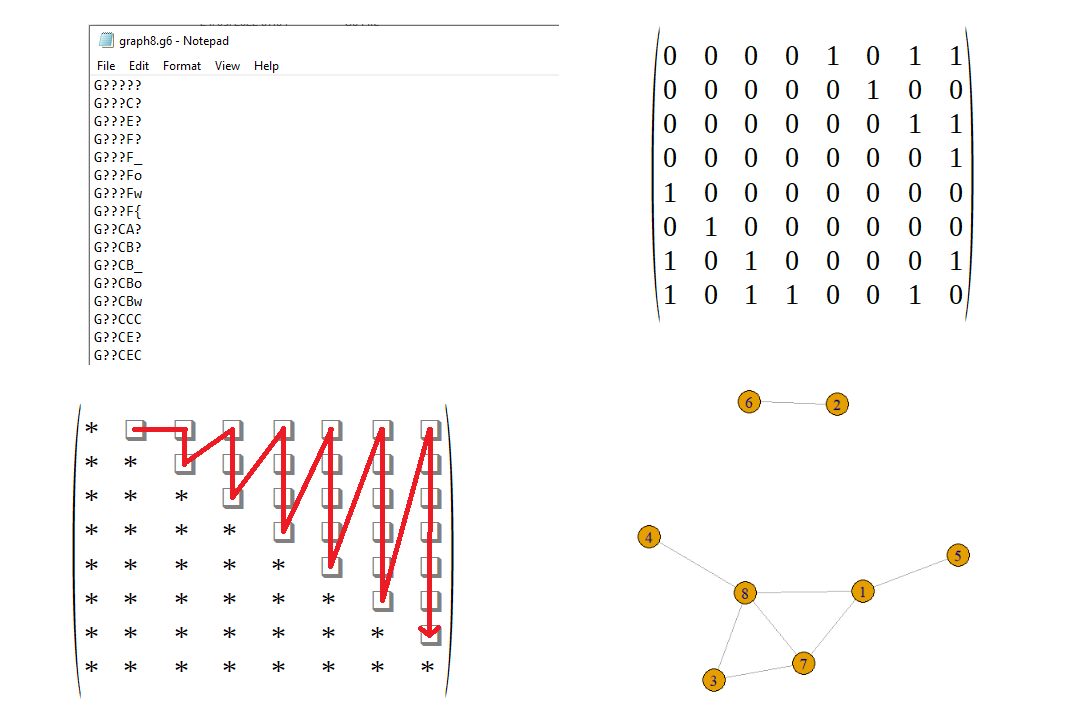
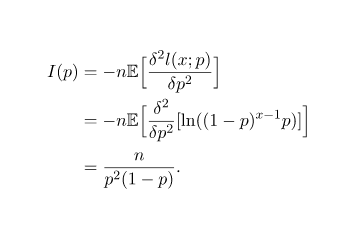
Explore Our Articles On Data Science Next Event SimulationModelling a dynamic system and extracting results on the system using R Visit Article Portfolio VaR in 8 StepsStep-by-step worked example of the Portfolio Value-At-Risk in Excel Visit Article The Mathematics of VaRA mathematical derivation of the Portfolio VaR highlighting the assumptions taken at each step Visit Article Common Questions about the Normal DistributionIncludes explanations of the z-scores, the confidence intervals and levels and the 68-95-99.7 rule Visit Article 3D & Contour Plots of the Bivariate Normal DistributionAn analysis of the structure of the contours and the conditional distributions Visit Article How to Generate Any Random VariableIncludes explanation of the Accept-Reject Method and the Analytical Inversion Method and worked example in R Visit Article Latin Hypercube Sampling vs. Monte Carlo SamplingThe convergence of the two sampling methods in the univariate and bivariate case Visit Article What is Centrality in Graphs?Includes the computation of various measures of centrality with igraph in R Visit Article Different Correlation Structures in CopulasComparisons between the Gaussian, Student t, Frank, Gumbel and Clayton copulas Visit Article Computing the Portfolio VaR using CopulasModelling the marginals and the correlation structure with a copula in order to find the VaR figure Visit Article What is a threshold graph?Using R to test if a graph is threshold, and to plot such a graph and its layer-cake diagram from its creation sequence Visit Article Loan PrepaymentCalculating the Prepayment Rate, Prepayment Rate Curves, Interest Lost resulting from an increase in repayments or a decrease in the interest rates Visit Article VaR Variance-Covariance Method CalculatorAn application whose inputs are stock names and quantity, and computes the value, distribution and VaR Visit Article How to embed R Shiny App on WebsiteA step-by-step approach with screenshots on how to embed your own app on your personal website Visit Article Signs and Symbols in valueBoxAdding Percentage, currency symbols and text to a valueBox in flexdashboard Visit Article Two-Way ANOVA Dashboard AppAn app performing data visualisation, Two-Way ANOVA modelling, diagnostics and post-hoc analysis Visit Article Multiple Comparison Tests for ANOVAA description of 5 methods of multiple comparison tests highlighting the appropriate use of each method Visit Article One-Way ANOVA Dashboard AppAn app performing data visualisation, One-Way ANOVA modelling, diagnostics and post-hoc analysis Visit Article The Standard Error of the difference in two ProportionsIncludes the derivation of three types of standard errors used for calculation of confidence intervals or hypothesis testing Visit Article How to calculate the Sample Size for A/B TestingIncludes the mathematical derivation of the minimum sample size for a variation. Includes Sample Size Calculator Visit Article Drawing Timeline Diagrams in RA function that plots financial mathematics timeline diagrams using the package "ggplot2" in R Visit Article Home Loan Prepayment CalculatorDetermines the actual duration of the loan when the monthly repayment is increase to constant value from some month onwards Visit Article How to calculate the Core DepositsCore Deposits are defined in terms of the confidence level and time, and simulation is used to find the core deposits of a portfolio Visit Article Histogram & Frequency Polygon Plot on Graph PaperA free online tool that automatically plots a histogram and a frequency polygon on a graph paper grid from the frequency table Visit Article How to make multiple Bar Charts in SPSSPlotting multiple Bar Charts for multiple variables on the same chart in SPSS Visit Article Generating Non-Isomorphic Graphs in igraph in RDecoding .g6 or graph6 format and converting to an adjacency matrix to use in igraph Visit Article The Cramer-Rao Lower Bound for the Geometric DistributionDeriving the lower bound for the variance of an unbiased estimator of its parameter. Visit Article